
This week the NOAA Marine Debris Program blog will focus on the NOAA Marine Debris Monitoring and Assessment Project. Stay tuned!
Marine debris is unfortunately an all too frequent sight on our coastlines. A common misconception is that all shoreline debris was left behind by beachgoers. In fact, debris makes its way to the beach from many different sources, including the sea, stormwater runoff, wind, and nearby river or stream outlets. If you spend time exploring shorelines in different regions, you may notice that the types and amounts of debris are different from place to place (and constantly changing!). Where does your local debris come from, and what are the most effective approaches to preventing debris from making it to shorelines in the first place? As we accumulate a larger dataset of shoreline debris loads across various regions of the US, through the Marine Debris Monitoring and Assessment Project (MDMAP), we can begin to better understand how environmental and political variables drive differences in debris loads.
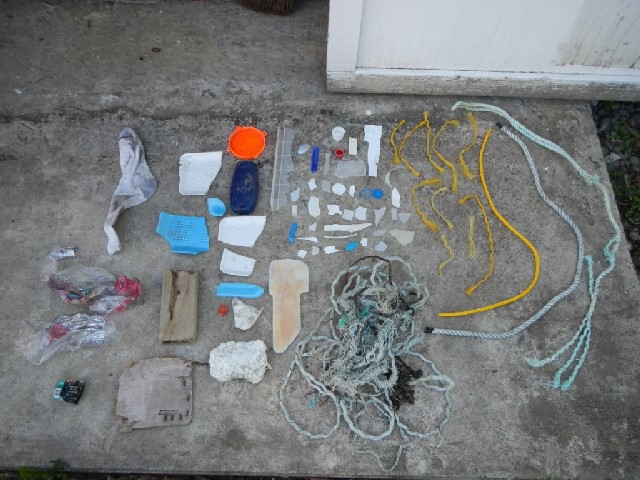
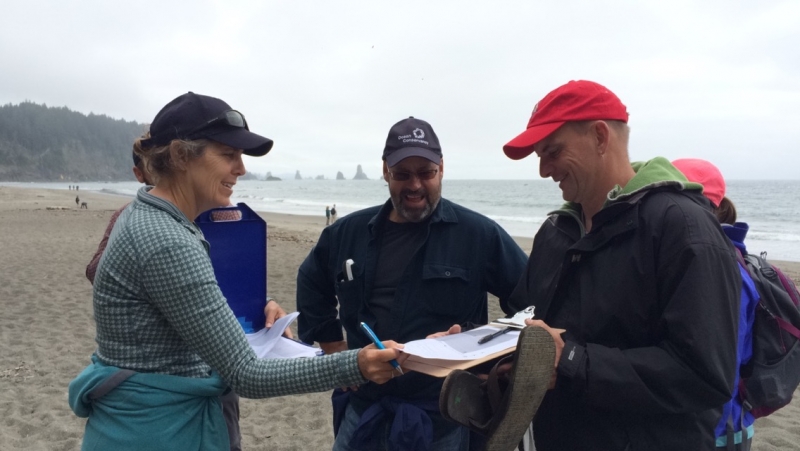
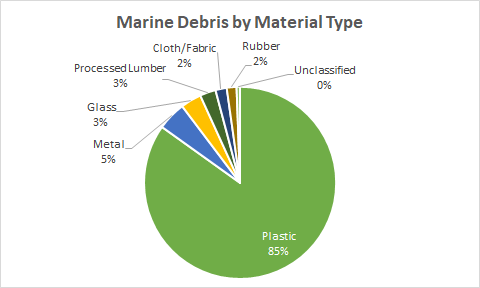
The MDMAP is a rigorous citizen science initiative that engages NOAA partners and volunteers in standardized surveys for marine debris items larger than 2.5 cm, or about the size of a bottle cap. Each passionate and dedicated partner in the MDMAP network selects a nearby shoreline monitoring site where they conduct specific survey protocols on a regular basis and submit meaningful data to NOAA’s MDMAP Database. To date over 650,000 debris items have been documented during MDMAP surveys, 85% of which are plastic. About half of these plastic items were fragments, meaning that they could no longer be identified as a larger item, or represented less than 50% of the original item.
The MDMAP dataset extends back to 2012, and we are learning a lot! The NOAA Marine Debris Program partnered with the Ocean Conservancy and the Commonwealth Scientific and Industrial Research Organisation (CSIRO) to conduct an assessment of the MDMAP and International Coastal Cleanup Datasets, which shed some light on geographic patterns and trends in marine debris distribution in the US. In addition, MDMAP data was used to demonstrate a ten-fold increase in debris items on the outer coast of Washington from the 2011 earthquake and tsunami in Japan.
Interested in learning more? The MDMAP Get-Started Toolbox is a great place to begin. The Toolbox provides tutorials that cover the basics of the MDMAP, a collection of protocol documents and user guides, data analysis tools, a searchable photo gallery of marine debris items, answers to frequently asked questions, and even a quiz to test your MDMAP knowledge. If you’re an educator, the Marine Debris Monitoring Toolkit for Educators translates the MDMAP for classroom use.
To keep up to date on the MDMAP, sign up for the “Litter Letters” newsletter by emailing us at MD.Monitoring@noaa.gov. The MDMAP would not be possible without the dedication of our amazing volunteers. We admire and thank you for your efforts!
thank you for the opportunity to learn through your blog